If there is one moment in macroeconomics where students collectively lose confidence, it’s the IS–LM diagram.
Two curves. One graph. Too many assumptions.
And somehow, this single picture is supposed to explain how the entire economy works.
But beneath the symbols and slopes, the IS–LM model is surprisingly intuitive. It’s not a mathematical monster — it’s a framework for understanding how spending decisions and money markets interact.
Once you stop treating it like a formula and start treating it like a story, it actually makes sense.
What is the IS-LM Model?
The IS–LM model explains how the real economy and the financial system come together in the short run.
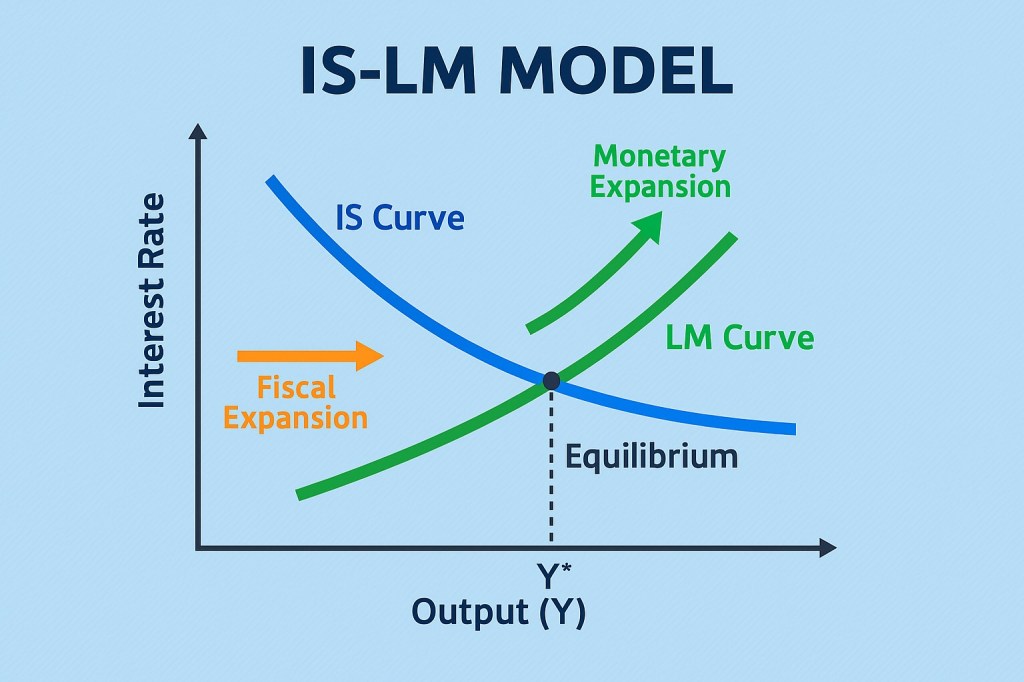
- The IS curve represents equilibrium in the goods market
- The LM curve represents equilibrium in the money market
Where they intersect, the economy is in balance — spending matches output, and money demand matches money supply.
That intersection tells us two things:
- the level of income/output
- the interest rate prevailing in the economy
Simple idea. Dense presentation.
The IS Curve: Spending and Interest Rates
IS stands for Investment–Saving — but don’t let the name confuse you.
The IS curve shows combinations of income and interest rates where planned spending equals total output.
Here’s the intuition:
- Lower interest rates → borrowing is cheaper
- Cheaper borrowing → more investment and consumption
- More spending → higher output
So when interest rates fall, income rises. That’s why the IS curve slopes downward.
Think of the IS curve as the economy’s spending mood. When rates are low, people spend. When rates are high, they hold back.
What Shifts the IS Curve?
Anything that affects spending other than interest rates shifts the IS curve.
Examples:
- government spending
- taxes
- consumer confidence
- investment optimism
An increase in government spending pushes the IS curve rightward — higher demand at every interest rate.
Fiscal policy lives here.
The LM Curve: Money and Interest Rates
LM stands for Liquidity preference–Money supply.
This curve shows combinations of income and interest rates where money demand equals money supply.
Here’s the story:
- Higher income → people need more money for transactions
- To hold more money, interest rates must rise (so people are willing to give up interest-bearing assets)
That’s why the LM curve slopes upward.
The LM curve reflects how tight or loose the financial system is.
What Shifts the LM Curve?
The LM curve shifts when money supply changes.
- Increase in money supply → LM shifts right → lower interest rates
- Decrease in money supply → LM shifts left → higher interest rates
Monetary policy lives here.
Central banks don’t directly control output — they control liquidity, and output responds.
Putting it Together: The Equilibrium
The intersection of IS and LM gives:
- equilibrium income
- equilibrium interest rate
Change fiscal policy? IS moves.
Change monetary policy? LM moves.
Change both? The final outcome depends on how they interact.
This is why the IS–LM model is so powerful: it shows policy interaction, not just isolated effects.
What the Model Gets Right — and What It Misses
The IS–LM model is elegant, but it’s not reality.
It works best in the short run, when prices are sticky and expectations are stable. It struggles with:
- long-run growth
- inflation dynamics
- open economies
- modern financial complexity
But as a teaching tool, it forces us to think clearly about cause and effect.
It reminds us that:
- spending depends on interest rates
- money markets respond to income
- policy choices ripple through both
Why It Still Matters
Even if policymakers don’t draw IS–LM graphs in meetings, the logic behind them shapes modern macroeconomics.
When governments debate stimulus or austerity, they’re thinking in IS terms.
When central banks raise or cut rates, they’re moving along or shifting the LM curve.
The model helps us understand why policies sometimes work — and sometimes cancel each other out.
The Takeaway
The IS–LM model isn’t about memorising curves.
It’s about understanding balance.
It shows us that the economy isn’t driven by spending alone or money alone — but by the interaction between the two.
Once you see it that way, the diagram stops being intimidating.
It becomes a map.
And like all maps, it doesn’t show everything — but it shows enough to help you find your way.

Leave a comment